
Traffico anomalo Google is a common issue that is often present in Google Analytics. Now that artificial intelligence has found applications in various fields, it is more than important to understand these traffic anomalies.
Digital marketing, in particular, becomes effective when the implemented strategies are based on data. For this reason, artificial intelligence is the key to success, thus making it an indispensable part of every business.
In this article, we will take a closer look at traffico anomalo Google to get a better understanding of it.
What is a Traffic Anomaly?
As the name suggests, a traffic anomaly is a deviation from the expected traffic. It is expressed by unusual traffic fluctuations that are nothing like the day-to-day network’s numbers. These fluctuations might signify intrusions, like DDoS attacks, which will pose a grave danger to the Internet security of the business.
In the long run, this might influence the quality of the provided services, leading to decreasing customer satisfaction. When it comes to traffico anomalo Google, these anomalies are expressed as sudden bursts of activity, which do not represent reality.
However, identifying the source of the anomaly is a challenge. Artificial intelligence in the workplace has also undertaken this role as it can provide innovative problem-solving.
What is Anomaly Detection?
Anomaly detection, or outlier detection, is the process of identifying the occurrence of traffic anomalies. It is a process that is widely used in data mining and data analysis and it often takes advantage of machine learning technology. At the moment, many businesses have automated the traffic detection process, utilizing these latest technologies.
The machine-learning algorithm uses time series data to perform anomaly detection. This practically means that it analyzes data in real-time. In essence, at any given time, the technology is comparing the actual metric with the expected one, based on historical data. Time series data is used because they lead to better predictive data.
In more detail, the algorithm is going to create a sequence of the expected normal data, when it comes to the specific analytics that it has been applied to. This way, it will immediately spot any suspicious fluctuations.
The Three Types of Traffic Anomalies
To effectively use AI in digital marketing, you must understand the types of traffic anomalies that you will encounter. Traffico anomalo Google can occur at any moment and take multiple forms. In fact, there are three main types of anomalies that can be detected in Google analytics. These types of anomalies are the following:
- Global Outliers: They are often referred to as point anomalies. These anomalies show data that are too far off the normal data set. They are fairly easy to spot as they are single instances that show abnormal behavior.
- Contextual Outliers: You will also find them referred to as condition outliers. This specific term refers to the anomalies that are context-specific. This means that a fluctuation might be normal in a data set, and an anomaly in another one. These specific anomalies are usually identified in seasonal data.
- Collective Outliers: These anomalies are appearing on the entirety of the data set, and they can signify a cyber-attack. Individual points of the data set will appear normal. However, when it is combined with another data set, the anomalies are going to be significant.
The Most Used Anomaly Detection Techniques
Since the field of anomaly detection is vast, there are many techniques widely used for it. Some of the most used techniques used to create algorithms for anomaly detection are the following:
- Density-based techniques
- Z-Score or Extreme Value Analysis
- Probabilistic and Statistical Modeling
- Bayesian Networks
- Hidden Markov models
- Linear Regression Models
- Cluster analysis-based techniques
- Fuzzy logic-based outlier detection
- Proximity Based Models
- Information Theory Models
Each one of these can be applied to the anomaly detection algorithms, which can then spot any occurrences on the analytics. Before selecting one, it is important to name the number of features used to detect these traffic anomalies (univariate or multivariate), as well as the distribution of values (parametric or non-parametric).
What are Traffic Anomalies in Google Analytics?
Traffico anomalo Google is an issue that all businesses and digital marketers will have to face at some point. When they try to analyze the KPIs and metrics of their website, they will find fluctuations that don’t reflect the real state of their traffic. In Google analytics, anomaly detection algorithms can be users to track:
- Pageviews
- Sessions
- Daily Active Users
- Cost Per Click
- Bounce Rate
- Customer Acquisition Cost, etc.
All of these metrics, as well as the goals you have set up, are important for the growth of your business. When an anomaly occurs, it will not only affect your services but also your revenue and your budget.
How to Detect Traffico Anomalo Google
In recent years, Google Analytics has implemented a Bayesian state space-time series model to the historic data so that it can predict the expected values of a dataset. This way, it can provide you with information on any anomalies that have occurred during a set period.
To check the traffic anomalies on Google analytics, you have to follow these steps:
- Log in to your Google Analytics account,
- Find the property you want to check, and then select your desired view,
- Click on the search bar and type a relevant question. For example, you can type “show me an anomaly in sessions this week”, or simply “anomaly in active users”.
The Most Common Anomalies Found in Google Analytics
Some of the most common traffic anomalies that you are going to encounter in Google analytics are the following:
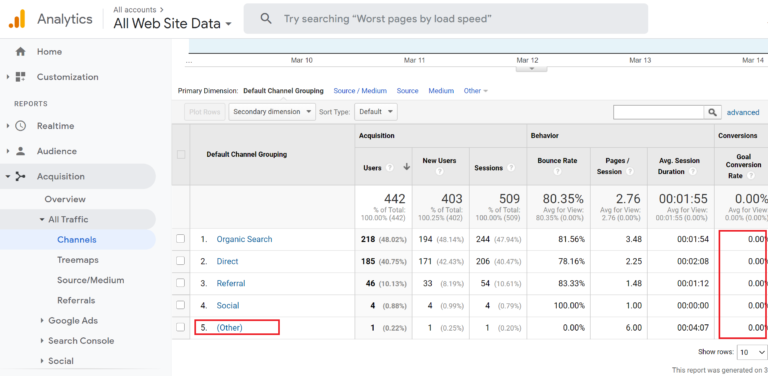
- Unusual spikes and drops in traffic: this is the result of spam bots targeting your website, which will affect the metrics that you see. Namely, you will notice an increase in referral traffic and a significant decrease in metrics, such as Avg. Time on Page, Pages/Session, and % Exit Rates.
- Uncommonly excellent bounce rate: This metric is a mystery to many businesses, even though it is an important one. If you suddenly notice that your bounce rate has dropped to 1-10%, you need to check out the cause for it as it might be an anomaly.
No matter the anomaly that you are encounter in Google analytics, you are going to receive an alert from the platform. Make sure that you always check your progress so that you can quickly react to any unexpected event.